Subscribe now to get notified about IU Jharkhand journal updates!
Stock Valuation Models: A Study of Models In Use And Development Of A Customized Model In India
Abstract :
Valuation of stocks has been the most important area of study in finance among the researchers in recent times. Valuation is the process of estimating the worth of a stock, which is important not only from the point of view of investment analysis, but also includes decisions on merger and acquisition, capital budgeting, financial reporting, determination of tax liability, in litigation, and due diligence among others. Researchers have worked on various genres of valuation models; however, despite over five decades of extensive research in this area, research findings remained inconclusive. This paper argues that one of the reasons behind these ambiguous findings is market efficiency. Efficiency of stock market implies whether it reflects all information available to the market participants at any given point of time. The Efficient Market Hypothesis (EMH) maintains that all stocks are perfectly priced or valued according to their inherent investment attributes, the knowledge of which all market participants possess equally (Fama, 1970). The paper tested the EMH in context of Indian stock market in the post liberalization era through a series of tests when several measures were initiated by the Government of India to strengthen the functioning of the stock market and bring in more transparency. However, the outcomes of the research suggest that despite substantial progress in this regard, the Indian stock market fail to validate all the three forms of EMH. This research also tried to find out the relationship between valuation and efficiency of stock market, which has not been explored or addressed adequately as most researches decoupled the two areas of study as independent and mutually exclusive. This research opines that integrating the above areas can help explain the inconsistencies in existing findings and simultaneously throw open new insights in this field of study.
Keywords :
Price-earnings ratio, Option, Capital Asset Pricing Model, Beta, Efficient Market Hypothesis, Event studies, Insider trading1. Introduction :
1.1 Background of the topic
A stock market is the aggregation of buyers and sellers of stocks (also called shares) which also include
securities listed in a stock exchange as well as those traded privately. Trade in stock markets means the transfer
of shares (stocks and securities) for money from a seller to buyer. Participants in the stock market range from
small individual investors to larger trader investors and also include banks, insurance companies, pension funds,
hedge funds etc.
Stock market plays an important role in capital formation of a country. Stock market is often considered as the
primary indicator of a country’s economic condition, its strength and development. It allows the business to
raise additional financial capital for investment by selling shares or units of ownership of the company in the
public market. Investors also participate in the transaction as a buyer of the shares in the stock market. The
liquidity provided by the stock market affords the investors to quickly and easily buy and sell their shares. This
is an attractive feature of investing in stocks compared to less liquid assets such as immovable property.
Valuation of securities is a method of ascertaining the intrinsic value of a stock based on its present financial
position and the forecast of various economic and corporate factors. Based on this intrinsic value and comparing
the same with the market price, investors normally take decision to buy, hold and sell the stock. Valuation
methods are very important because it creates the link between the market price and firm’s financial position.
Finding the correct method of valuation is a complex task due to the involvement of multiple factors. Efforts have been made in the past to find the most suitable method of
valuation, ranging from a simple to a very complex method taking into the consideration relevant factors at the company’s level like earnings, dividend, risk, cost of money and
future growth rate etc. In addition to that many macro-economic factors like price level, money supply, inflation or the interest rate level have also been considered.
Broadly there are three types of valuation methods, namely:
- Absolute valuation method
- Relative valuation method
- Option valuation method
Absolute valuation models attempt to find the intrinsic value of a stock based only on fundamentals. Looking at fundamentals simply mean one would only focus on such things as dividends, cash flow and growth rate or variables limited to a single company. Valuation models that fall into this category include the dividend discount model, discounted cash flow model, residual income models and other asset-based models.
While absolute value models are widely accepted in the academic fraternity because of its rigor; they are seldom used by practitioners. Researchers value stocks by applying a close surrogate of earnings multiple (usually price to earnings or simply P/E multiple). The approaches to the establishment of the P/E multiple covers a wide range. Most researchers use historical P/E multiple of stocks or the historical P/E multiple of a stock or panel data across a particular industry or a market proxy (usually an index).
One of the earliest empirical studies to use this approach was (Whitbeck- Kisor, 1963). According to this model the P/E multiple of a stock was related to its earnings, payout policy, and risk. Accordingly, the relationship was defined as: P/E multiple = 8.2 + 1.5 (projected earnings growth rate) + 6.7 (dividend payout) – 0.20 (variation in earnings).
An option is a financial contract which gives the buyer the right, but not the obligation, to buy or sell an underlying asset at a specified strike price on or before a specified date. The seller has the corresponding obligation to fulfill the transaction, which is to sell or buy respectively, if the buyer exercises the option. In essence, the buyer of an option can hold on to the right till maturity or sell it before the expiry date. In finance, a price is paid or received for purchasing or a selling option.
The valuation of equity share is considered as the residual claim, i.e. equity holders lay claim to all cash flows left over after other financial claim holders (debt, preferred stock etc.) being satisfied. If the firm is liquidated, the same principle applies with equity investors receiving whatever is left over in the firm after all outstanding debts and other financial claims are paid off. The principle of limited liability protects the equity investors in publicly traded firms if the value of the firm is less than the value of the outstanding debt, and they cannot lose more than their investment value. Therefore, the pay-off to equity investors is identical with the pay-off available to the buyer of a call option. Equity thus can be viewed as a call option of a firm, where exercising the option requires the firm be liquidated and the face value of the debt is paid off.
The efficient market hypothesis suggested by Fama deals with how information is incorporated in the stock price and considers the speed of impounding of information. It has historically been subdivided into three categories, weak, semi-strong and strong, each dealing with different types of information.
The weak form of efficiency tests whether all information contained in historical prices are fully reflected in current prices. Semi-strong form of efficiency tests whether all publicly available information are fully reflected in current stock prices. Finally, the strong form of efficient market hypothesis is the test of whether all information, public and private are fully reflected in security prices and whether any type of investors can make extra profit.
The efficient market hypothesis has strong implication for security analysis. If for example, empirical tests find that future returns cannot be predicted from past returns, then trading rules based on an examination of the sequence of past prices are meaningless. If the semi strong form of hypothesis is supported by empirical evidence, then trading rules based on publicly available information have no value. Finally, if the strong form tests show efficiency then the value of the security analysis itself would be a suspect. Thus, an understanding of efficient market tests should provide guidance in determining what type of analysis is useful.
However, understanding the efficiency of the stock market is very important in context of the testing valuation models in that particular market, because most valuation models presume an efficient market. The term ‘efficient market’ broadly means that the security prices fully reflect all available information. However, most tests of the efficient market hypothesis simply deal with how fast information is incorporated but does not deal with if the information is correctly incorporated in the price.
1.2 Significance of the study
The stock market of India has gone through a series of revolutionary changes since economic liberalization commenced in 1991. The changes were
necessary to transform Indian stock market into a more efficient one. Earlier, the stock market of a developing country like India was characterized
by extensive governmental regulation over its financial system and investment activities. Moreover, it was an underdeveloped capital market which was
influenced by:
- Restriction on capital structure
- Fewer instruments
- Rationing of commercial bank credit
- Restriction on investment opportunities
- Underdeveloped securities market
- Uncertainty in supply of inputs
- Complex bureaucracy and regulatory norms
The Indian stock market has witnessed a number of changes as well as unprecedented growth since 1991. Several measures have been initiated by the Government to strengthen the operations of the stock market. Some of such measures can be summarized as follows:
- Liberalization and globalization of Indian economy
- Formation of Securities Exchange board of India (SEBI)
- Establishment of new stock exchanges and Over the Counter Exchange of India (OTCEI)
- Introducing free pricing of public issue
- Advent of foreign institutional investors
- Setting up advisory panels for primary and secondary markets
- Inspect the affairs of stock market
- Entry of private sector mutual fund
- Electronic linkage of the stock exchanges
- Easy transferability of stocks
- Dematerialization of stocks
- Smaller marketable units of stocks
- Introduction of Derivatives
Therefore, there is a need to test valuation models and to develop a customized model in context of the Indian stock market in the post liberalization era. This research also carried out tests of efficiency in context of the Indian stock market to measure the degree of strength and maturity.
1.3 Scope and Objective:
The objectives of the research are:
- To test a price-earnings (Whitbeck-Kisor) valuation model in context of the Indian stock market
- To test Capital Asset Pricing Model (CAPM) in context of the Indian stock market
- To develop a customized valuation model
- To test the customized model so developed
- To test the efficiency of the Indian stock market (All three forms)
- To find if any relationship exist between valuation and efficiency of the stock market
All the three efficiency tests (the weak form, the semi strong form and the strong form) will be conducted in context of the Indian stock market for a period starting from 1996-2015.
The research will throw new insights into the Indian stock market and its behavior. Stock market has undergone a series of changes and it is necessary to test the market efficiency since most of the tests were conducted in context of a developed economy. Moreover a customized stock valuation model will also help to identify the factors that drive the stock price in the Indian stock market in the post liberalization era.
1.4 Research Gap:
The most of the researches that has been carried out in testing the efficient market hypothesis are in context of developed market where efficiency levels are significantly higher. Therefore their application in the Indian context is debatable, considering the differential levels in market efficiency. Also with the continuous process of transformation of the Indian stock market, there is a need for the test the efficiency of the Indian stock market in the post liberalization period and to formulate a customized valuation model applying multivariate regression analysis. This research tried to find out the relationship between valuation and efficiency of stock market, which has not been explored or addressed adequately as most researches decoupled the two areas of study as independent and mutually exclusive. This research opines that integrating the above areas can help explain the inconsistencies in existing findings and simultaneously throw open new insights in this field of study.
1.5 Literature review
A: Absolute Valuation
The dividend discount model calculates the intrinsic value of a stock based on the series of dividends of a company pays to its stockholders. The
justification for using dividends to value a stock is that dividends represent the actual cash flows going to a stockholder, thus valuing the present
value of these cash flows should give you a value for how much the stock should be worth. Second, it is not enough for the company to just pay
dividend; the dividend should also be stable and predictable. What if the company does not pay a dividend or its dividend pattern is irregular?
Further refinements led to absolute valuation model using a firm’s discounted future cash flows to value the stock. The advantage of this approach is
that it can be used for a wide variety of firms that does not pay dividends, and even for companies that do pay dividends. Absolute valuation models
also differ in terms of their time frame under study. In a single period valuation, one needs to forecast the expected dividend and the value of the
stock at the end of the year. In a multi-period model the intrinsic value depends on present value of the infinite streams of dividends the
stockholders expects to receive. At this point one might question, why earnings an important parameter not factored in these models. Technically,
earnings can be used for one of the two purposes: they can be paid out to stockholders as dividends, or they can be ploughed back for future
reinvestments. If they are reinvested, they are likely to increase future earnings and hence future dividends. Therefore, discounting future earnings
leads to duplication and therefore should be avoided.
B: Relative Valuation
While absolute value models are widely accepted in the academic fraternity because of its rigor; they are seldom used by practitioners (Bing, 1971). Researchers value stocks by applying a close surrogate of earnings multiple (usually price to earnings or simply P/E multiple). The approaches to the establishment of the P/E multiple covers a wide range. Most researchers use historical P/E multiple of stocks or the historical P/E multiple of a stock or panel data across a particular industry or a market proxy (usually an index). Another distinctive approach is to list and discuss a set of factors that are perceived to affect P/E multiples, but leaving the weighing and often explicit definition of these factors to the researchers individual perspective (Graham, Dodd, and Cottle, 1962). Cross sectional regression analysis is used to define the weights on a set of hypothesized determinants of a stock’s price over a period of times. At the more generic level multi-variate regression analysis is applied on a set of stocks of relating the P/E multiple to more than one variable.
One of the earliest empirical studies to use this approach was (Whitbeck Kisor, 1963). According to this model the P/E multiple of a stock was related to its earnings, payout policy, and risk. Accordingly, the relationship was defined as: P/E multiple = 8.2 + 1.5 (projected earnings growth rate) + 6.7 (dividend payout) – 0.20 (variation in earnings).
This equation represents an estimate at a point in time of the simultaneous impact of the three independent variables on the dependent variable. The
beta coefficients represent the weight that market places on each variable at that point in time. The signs represent the direction of the impact of
weight variable on the P/E multiple. It is important to note that that the weights and signs are dynamic and are likely to vary across time as well
as across contexts. The overall explanatory power of the model was quite high, given that fact that the signs are consistent with existing theory and
common financial acumen. An equation, such as this, can be used to arrive at the theoretical P/E multiple for any stock by substituting the values of
the independent variable forecasts. Such findings can be used for investments decisions to go long or short on a particular stock. There are
indications that interests in such models have increased off-late. Every conceivable variable and combination has been tried (Bower and Bower, 1969;
Gruber, 1971; Malkiel and Cragg, 1970) for predicting stock outcomes with varying degrees of success.
C: Option Valuation
An option is a financial asset which gives the buyer the right, but not the obligation, to buy or sell an underlying asset at a specified strike price on or before a specified date. The seller has the corresponding obligation to fulfill the transaction – that is to sell or buy – if the buyer exercises the option. In essence the buyer of an option can hold on to the right till maturity or sell it before the expiry date. In finance, a price is paid or received for purchasing or a selling option. This transaction depends on its value, underpinning the valuation of the option. The valuation of an option can be split into two components. The ‘intrinsic value’ is the difference between the underlying price and the strike price, to the extent that this is in favor of the option holder. For a call option, the option is in-the-money, if the underlying price is higher than the strike price; then the intrinsic value is the underlying price minus the strike price.
D: CAPM
The Capital Asset Pricing Model (CAPM) and its variants including the Single Index Model though not purely a valuation model, it inherently helps in the assessment of expected return of stocks. The model enables to determine a theoretically appropriate required rate of return of an asset, if that asset is to be added to an already well-diversified portfolio, given that asset’s non-diversifiable risk. The model takes into account the asset’s sensitivity to non-diversifiable risk (also known as systematic risk or market risk), often represented by a measure beta (β). Beta measures the sensitivity of a stock vis-à-vis the market or its close proxy, as well as the expected return of the market and the expected return of a theoretical risk-free asset. The model suggests that an investor’s cost of equity capital is determined by its beta (Fama, 1968; Sharpe, 1964). Despite the refinements to more modern approaches to asset pricing and portfolio selection such as Arbitrage pricing theory, CAPM still remains popular due to its simplicity and utility in a variety of situations. However, empirical studies in the US as well as in India conclude that the results are dichotomous.
In the late 1970s, CAPM came under severe criticism as striking inconsistencies of the model was reported. These inconsistencies underlined the fact that firm characteristics such as firm size, book-to-market value, P/E multiple, and prior return performance have more explanatory power in explaining cross-sectional variation in returns. One of the earliest inconsistencies as reported by Basu (1977) relates to the P/E effect. Firms with low P/E multiple yielded higher sample returns and firms with higher P/E multiple ratio produced lower returns than justified by beta. Banz (1981) reported the empirical contradiction of the model in terms of size effect. He observed that market capitalization amplifies the explanation of the cross-section of average returns. More recently, Fama and French (2004) reported that beta as a sole explanatory factor of stock return is dead. They argued that portfolios formed on the basis of ratio of book value to market value and size earns higher returns than what is predicted by CAPM.
Srinivasan (1988) finds that CAPM relationship is valid for a large sample to draw meaningful inferences. Varma (1988) also finds results reasonable support for CAPM. Yalwar (1988) finds that CAPM is a good descriptor of stock returns, despite the study being based on individual stock return rather than portfolio return. Gupta and Sehgal (1993) explicitly addressed issues related to non-linearity and the role of residual risk in explaining returns. In contrast, they concluded that CAPM did not seem to be a suitable descriptor of asset pricing in the Indian context. The risk-return relation over the period is positive but weak and insignificant. Ansari (2000) using data from the Indian context in the early periods of economic liberalization mentions that the postulates of CAPM stands vindicated. The above results indicate that sensitivity of the results to holding periods cannot be ruled out; a relatively large sample and longer period of study may cast aside some aspects of empirical failures. Thus, robustness is important before arriving at any meaningful conclusion. Madhusoodanan (1997) also did not find any positive relationship between risk and return; the maximum risky portfolio gave the minimum return while the minimum risky portfolio yielded comparably higher return. He suggested that high risk and high return strategy will not be rewarding in the Indian context and it is better to opt for low risk stocks.
E: Market Efficiency
The efficient market hypothesis has been classified in extant literature into three distinct categories: a) Weak, b) Semi-strong, and b) Strong form. These classifications were originally suggested by Fama (1988).
Strong form is suggestive of the fact market at any point of time fully reflect all information (public or private) in stock prices. Note that market efficiency does not imply that the market value of a stock will always to mimic its intrinsic value. An efficient market is one in which the market value is an unbiased and independent estimate of its intrinsic value. Therefore, investor’s possibility of generating excess returns consistently is almost ruled out. In support of this proposition it was observed that fund managers under-perform a combination of passive indices combined to have the same risk after management fees and expenses are taken into account (Elton, et. al., 1990). This could also probably be due to the reluctance of fund managers to take exposure in small-cap stocks which in evidently have excess returns when measured relative to the CAPM or even justify their fees and the expenses they incur.
However, even in the US which symbolizes the epitome of strong form, excess returns have been identified over varying time periods. Though existing research has failed to explain this inconsistency, the source of excess returns is probably due to ‘superior’ use of publicly available information rather than monopoly access or even insider trading. This again supports our earlier conjecture, the mere availability of data does not makes a market perfect, its interpretation does. In support, past studies by Jaffe (1974) and Lorie and Niederhoffer (1968) found patterns of excess returns which could be due to trading based on privileged information, unless these traders happened to possess superior analytical skills, both of which seems equally likely. This is particularly true, given the increasing trend of Wall Street deploying the services of ‘rocket scientists’ and using high end analytics and optimization tools to manage their risks (for a detailed reading see www.msci.com). On the overall, research indications are that US stock market scores high on informational efficiency, however, the presence of market rationality across all investor segments cannot be necessarily presumed.
Market volatility tests by LeRoy and Porter (1981) and Shiller (1981, 1984) also confirms the above proposition. Volatility tests examine volatility of stock prices relative to the volatility of its intrinsic value. Markets are said by inefficient if market values of stocks in general display volatility which defies its fundamentals. An analysis of forecasts by a large number of independent advisory services revealed that a change in classification either upward or downward generated excess returns, which was also found to be sustainable and not a mere correction. Acting on changes in classification produced larger excess returns than acting on the recommendation themselves. In addition, no superior forecasters could be identified. Investor’s were better off following the advice of the average or consensus forecasts rather than follow the advice of set of forecasts based on their past track record. Further, Stickel (1985) found that the market displayed more volatility than the fundamentals on which advisory services were based. This substantiates our earlier point regarding the evidence of analysts having information not fully incorporated in stock prices or a confirmation of market rationality. These studies assume importance because this is the most basic form through which the financial community at large receives information. Therefore valuation and its subsequent refinements make sense even in efficient markets like the US to generate excess returns, even if not on a consistent basis.
In addition to information efficiency, Fama (1988) considers the semi-strong form with the speed at which information is discounted in stock prices. This refers to event studies or studies of announcements and its subsequent impounding in stock prices. A potential lag between an announcement and its impact is an impediment to market efficiency and creates a potential opportunity to trade in stocks and generate excess returns. The semi-strong form does not deny the presence of value based information, nor does it deny the impact it creates on stock prices. It supports the view that excess returns are possible by taking advantages in the inefficiencies in the discounting process. If returns are not predictable from past returns, then new information is incorporated in stock prices sufficiently fast that, by the time an investor could tell from the price movements themselves that there had been a fundamental change; the fundamental change is already reflected in the price. However, since the efficient form argues that return forecasts are indeed possible from past returns, therefore there is a potential delay in fundamental changes being reflected in price changes. Results from a wide range of ‘event studies’ affirms that markets are by and large efficient with regards to routine announcements like dividends, rights, stock options, etc. (Krauss and Stoll, 1972; Grier and Albin, 1973; Dodd and Ruback, 1977). However, there exists significant asymmetry with regards to strategic announcements like M&A or otherwise, which takes significantly longer time duration for its obvious analysis and impact (Firth, 1975). Davies and Canes (1978) also supports this view and points towards the definite presence of such inefficiencies in the Asian markets, if not in the US as well.
Under the classification of anomalies or patterns (high or lows) in returns being identified from past data, Fama (1988) identified excess returns in January and on Mondays in US. On the lines of these tests the authors own research on the Indian markets spanning (1991-2015) clearly indicates significant excess returns in November. November is historically the month in which Diwali is celebrated (marking the start of the Indian financial year across a vast section of the Indians, and stock broking community in particular). It is at this point of time investors square of their past transaction and strike new deals and take fresh positions, traditionally though to be auspicious. This pushes up the volumes and results in the distinctively excess returns. The same phenomenon has been observed in case of other product markets too. In the gold bullion market in India (which coincidentally also accounts for about 50% of global consumption) excess returns has been observed in the months of April and November. Both these months are considered to be auspicious from the religious point of view and mark the dedication to the god/goddess of wealth and prosperity; popularly known as Akshaytritiya and Dhanteras. It requires little market rationality that these events spark of buying behavior and has the distinct potential to generate excess returns; no wonder the logic also undermines the deep linkage between business and religion in India. The above studies indicate the strong possibility of valuation studies being used in slightly weaker markets like Asia to generate excess returns. However, it needs to be mentioned that models developed in the Western context cannot be applied in its exact form without sufficient customization. As models developed in one context may not work in other contexts because of methodological and behavioral issues as explained earlier.
The weak form tests whether all information at all gets fully discounted in stock prices over a reasonable period of time. According to extant research, most Asian markets (including India) score low on informational efficiency as well as market asymmetry. Barua and Raghunathan (1987) tested the market efficiency in India based on actual returns. Their results indicate that the Indian capital market is inefficient in pricing its stocks. Similar views finds support in the works of Rao (1988) and Maheshwari and Vanjara (1989) as well. Obaidullah (1991) noted that daily returns as well as Sensex (a market proxy) returns differed significantly from normality whereas monthly Sensex returns were not significantly different from a normal distribution. The monthly returns were positively skewed and leptokurtic but not statistically significant. Barua and Raghunathan (1990) in a small sample study concluded that on an average shares are over-valued in the Bombay Stock Exchange. The indication of a one-sided skewness is another dimension of low efficiency. It should be pointed here that the period of study assumes significance, due to the fact that the GoI adopted various liberalization measures 1991 onwards. However, the findings in the Indian context are not free from dichotomies either. Barua (1981) in his paper using runs test and serial correlation tests found preliminary
evidence suggestive towards market efficiency in India. However, the general consensus is that Indian markets score low on efficiency with regards to Western contexts.
It should be noted here that Roll (1994) pointed out that efficiency and ‘randomness’ is displays one-way causality. Efficient markets are expected to display randomness; but randomness per se may not be due to efficiency. This is a critical insight for future research. We conjecture Indian markets display randomness due to reasons different from Western contexts. The presence of a high degree of ‘soft’ infrastructural bottlenecks prevents the free flow of information in an economy. Low internet penetration and slow band-width in India is a clear indication in this regard. Further, low financial literacy (a factor which acts as an impediment to efficiency) is clearly wide spread. The continued presence of ‘ponzi’ schemes despite over two decades of liberalization is another pointer in this regard. Most retail investors hold undiversified portfolios indicating the presence of diversifiable risk as well, the median portfolio size being 4.7. Liquidity is possibly another serious problem faced by Indian investors; a consultative paper by SEBI indicated a poor liquidity situation at the stock exchanges in India. The Pareto’s 80:20 rule aptly applies here as well; 80% of the liquidity finds way 20% of the stocks. Insider trading and lack of transparency still persists. Adequate computerization has taken place, but the market is basically driven by FII investments. Hot money basically flows into avenues for purposes beyond risk and return, also justifies our view point. With the presence of multifarious inefficiencies in the Indian context, it might quite be possible that any amount of customization of valuation models may still reveal inconsistent and insignificant results.
2: Methodology
2.1 Data Base:
The data required for this research was mostly secondary in nature. The secondary data collected from the following sources:
- Company data from Centre for monitoring Indian Economy (CMIE)
- Stock market data published by different stock exchanges and websites
- Economic reviews of different Govt. authorities
- Audited Balance sheet and profit and loss statements of different companies
2.2 Method of collecting data:
The research has been conducted using data mostly secondary in nature. For objectives numbers 1, 2 and 5 secondary data has been collected from the CMIE (Centre for Monitoring Indian Economy) PROWESS data base. Additional information collected from various websites i.e. bseindia.org, moneycontrol. com, nseindia.org etc. For the formulation of the customized model, i.e. objective number 4, primary data collected from individuals who are working in the field of stock valuation in the Indian stock market. A ‘Feedback Form’ sent to 19 Mutual Fund companies and the customized model is developed on the feedback received from 10 respondents.
2.3 Period of reference:
The main objective of the research is to test valuation models and develop a customized model and testing the efficiency of Indian stock market in the post liberalization period. Hence a period of 1996 – 2015, a period of 20 years has been selected for the research. However, the Whitbeck-Kisor model tested for the period 2000-2015 since the standard deviation calculated for a period of five preceding years, i.e. standard deviation for the year 2000 calculated for 1996-2000. The customized valuation model also formulated for the period 2000-2015 as both the models considered the price earnings ratio as dependent variable. Research conducted for the other tests covered a period of 1996 – 2015.
2.4.1Test of price-earnings (Whitbeck-Kisor) valuation model in context of the Indian stock market
Data for price earnings ratio (dependent variable) and historical growth rate of earnings per share (independent variable), dividend pay-out
(independent variable) and standard deviation of earnings (independent variable) collected for 100 stocks included in S & P BSE 100 broad based index.
Regression analysis done using SPSS 17.0 tool for the above mention data and the result thus obtained analyzed using F test.
Null Hypothesis
Ho: A significant relationship exists between price earnings ratio (dependent variable) and growth rate of earnings per share (independent variable),
dividend pay-out (independent variable) and standard deviation of earnings (independent variable).
Beta and return of all stocks are calculated for each year. Equal weighted portfolio of the stocks are formed and grouped in deciles. All stocks are
grouped into 10 deciles and average return of the stocks included in the group calculated. Ranks are assigned to each group for beta and return.
Groups are arranged from higher rank to lower rank of beta and ‘d’ is calculated as the differences in ranks of beta and return. The risk and return
relationship explored by using Spearman’s Rank Order Correlation formula. Rank Correlation Critical value compared with the observed values of
correlation coefficient ‘r’. For small values of n, (n<30) the distribution of r is not normal and the acceptance and rejection determined from the
table using F Test.
Null Hypothesis
Ho: No correlation exists between the ranked data, i.e. beta and return of BSE 100 stocks during 1996-2015.
The process followed is a ‘primary survey’ among the eligible and qualified professionals who are working in the field of equity research for a
considering period of time in the Indian stock market. They were asked with a question, ‘What are the factors, you consider affecting the
price-earnings ratio of the Indian stocks during 2000-2015? From the feedback obtained from the respondents, the quantitative variables are
identified and data collected from CMIE Prowess system form 2000 – 2015 for the stocks included in the BSE 100 index. Stepwise regression analysis
done using SPSS 17.0 tool, as price-earnings ratio as dependent variable and other nine quantitative factors as independent variables. By using
stepwise regression analysis by SPSS 17.0 tool, the customized model developed which shows the optimum value of R square for beta, debt-equity ratio
and age as the independent variables.
Null Hypothesis
Ho: A significant relationship exists between price earnings ratio (dependent variable) and the independent variables as formulated by the model.
The test of market efficiency conducted for weak form, the semi strong form and the strong form. The methods will be followed for the test of the
weak forms of efficiency
- Monthly pattern
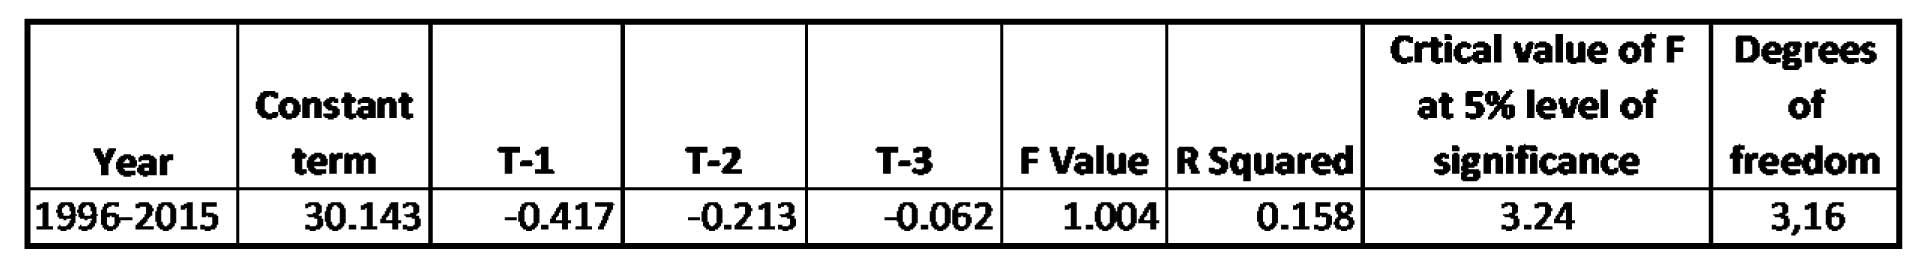
- Regression test
Null Hypothesis
Ho: A significant relationship exists between current year’s return on S & P BSE 100 Index (T) (dependent variable) and the previous three year’s return i.e. T-1, T-2 and T-3 (independent variables)
The method for the semi strong form of efficiency will be followed as follows:
- Collection of 30 sample firms (included in BSE sensex) that had a surprise announcement (Bonus declaration, stock split, Changed dividend policy etc.)
- Determine that particular day and designate day as zero
- Defining the period to be studied
- Computation of the return on each of the days being studied
- Computation of the abnormal returns for each of the days being studied for each firm in the sample
- Computation of the average abnormal return for each day in the event period for all the firms in the sample
- Each day’s abnormal return is added together to compute the cumulative abnormal return from the beginning of the period
3: Observations and findings
3.1 Data analysis and discussions3.1.1 Test of a price-earnings (Whitbeck-Kisor) valuation model in context of the Indian stock market
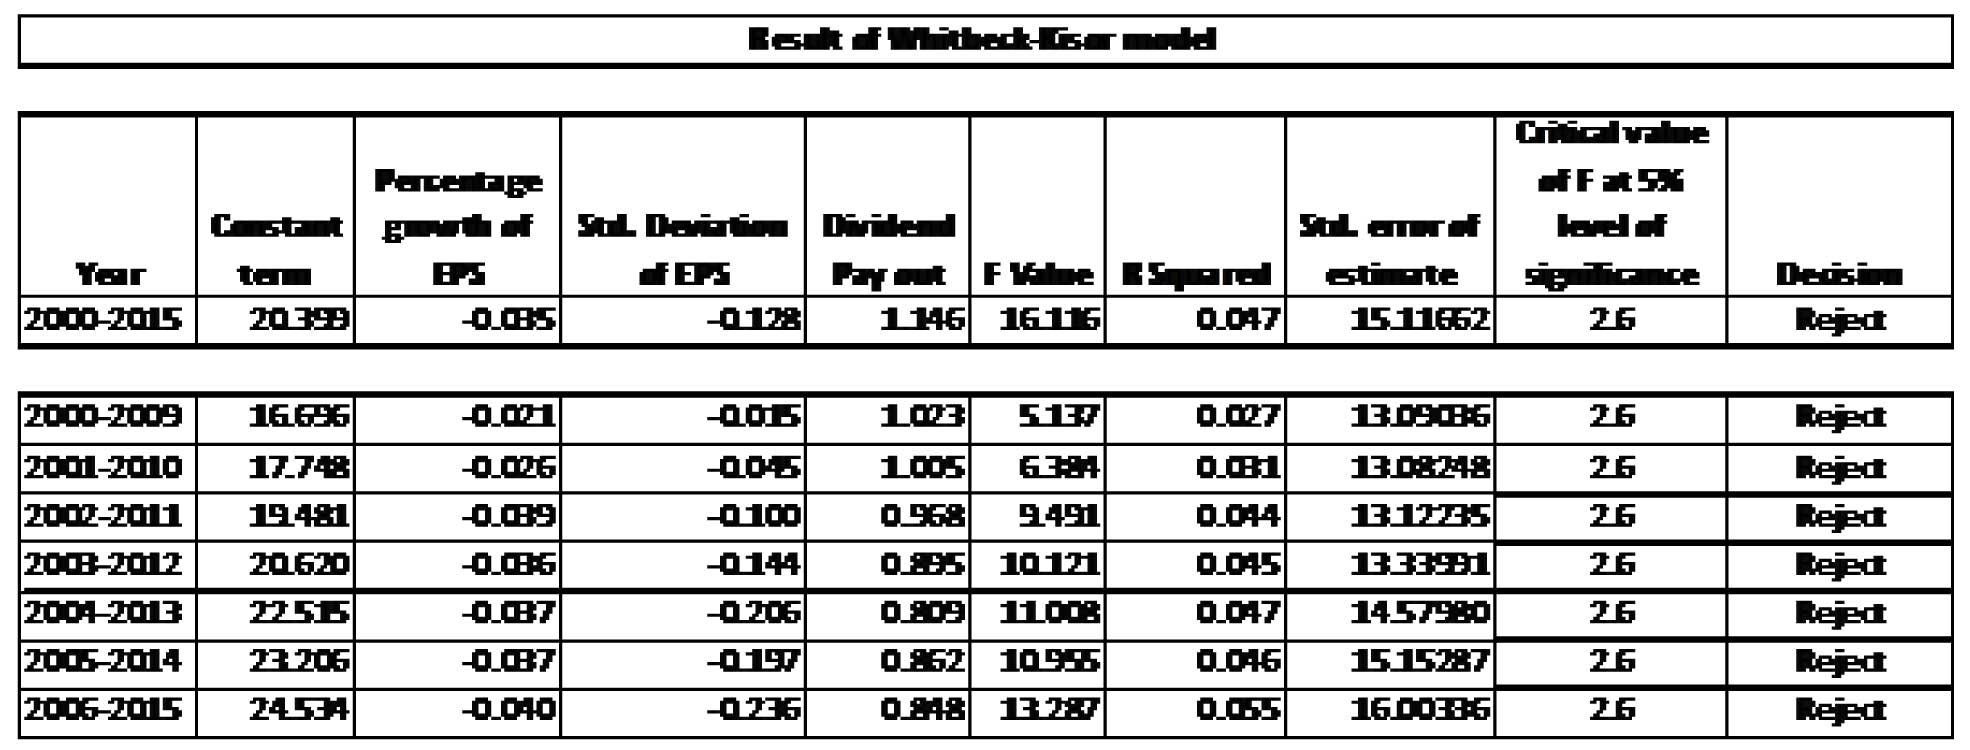
- The model established a negative relationship of price earnings ratio with growth of earnings per share and std. deviation of earnings per share but a positive relationship with dividend payout.
- Poor values of R-square reveals that the model is not validated in the Indian stock market not only during 2000-2015 but also during cross sectional periods of ten years each during the same time frame.
3.1.2 Test of Capital Asset Pricing Model (CAPM) in context of the Indian stock market
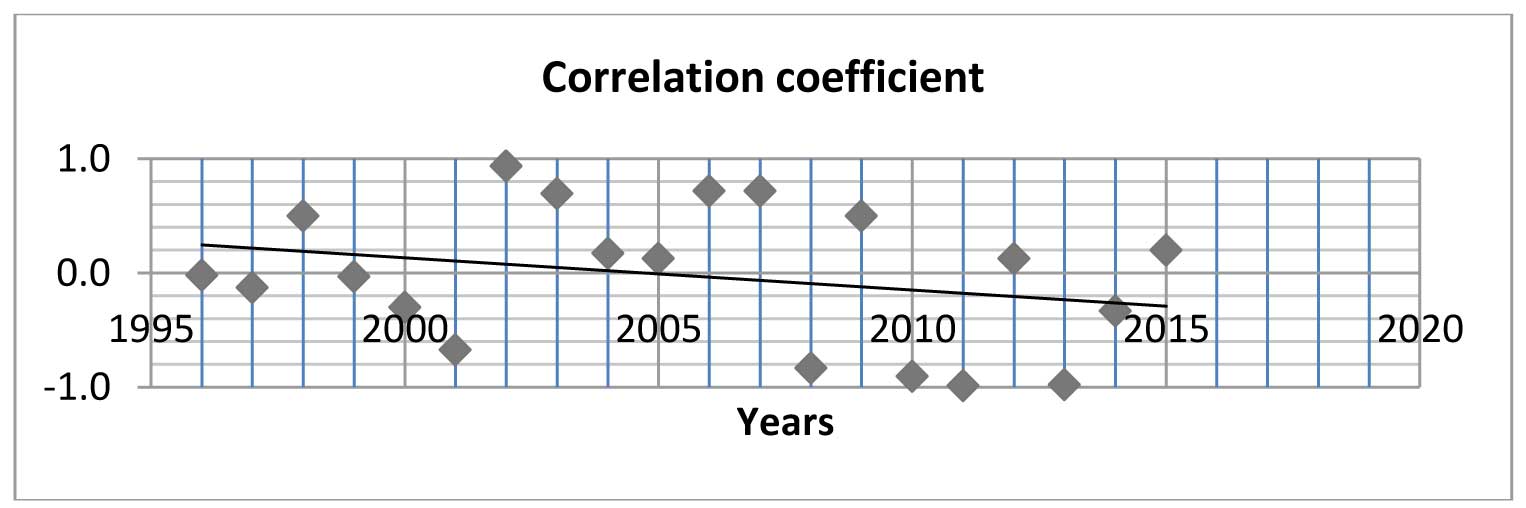
- Except for the years 2002, 2003 and 2006, 2007; correlation coefficient ‘r’ did not show the desired relationship during the time frame of 1996 – 2015.

- The result shows that the Indian capital market discounted the three variables the age (negative relationship), the debt-equity ratio (negative relationship) and beta (strong positive relationship) explaining the price earnings ratio for the period of 2000-2015 with a very poor R-square value of 9.6%.
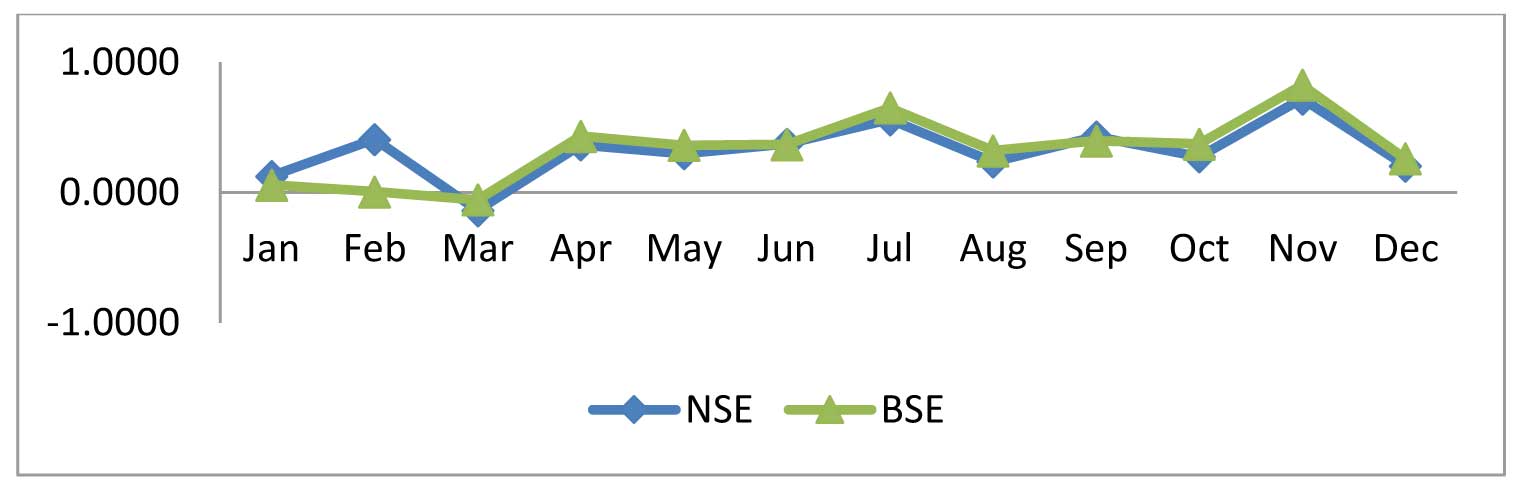
- (i) Time pattern of security return: It is possible to earn positive return by selling prior to March and buying before July or November irrespective of the market condition. This contradicts with the weak form of efficiency which states the movement of the market is random and should not follow any pattern. In an efficient market, no investor can earn extra return analyzing the historical seasonal pattern of stock return.
- (ii) Correlation test: The result shows a positive constant term and negative coefficients for all the three dependent variables with a very low R square value. The research also concluded that there is a significant relationship exists between current year’s return on BSE 100 index (T) (dependent variable) and the previous three year’s return i.e. T-1, T-2 and T-3 (independent variables).
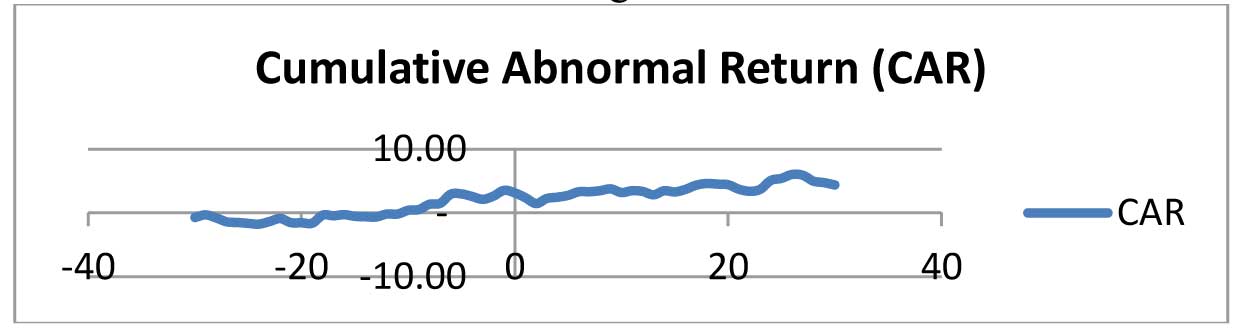
3.1.5 Test of semi-strong form of efficiency of stock market
- Study conducted on the movement of share price of 30 selected firms (included in the BSE sensex) around day 0 and Cumulative Abnormal Return (CAR) calculated and plotted To satisfy the condition for semi-strong form of efficiency, abnormal return can be observed on the date of announcement but not other days. In our experiment, abnormal positive returns observed on the days from -30 till +30. The graph clearly shows that the Indian capital market fails to satisfy the test of semi-strong form of efficiency and showed existence of insider trading.
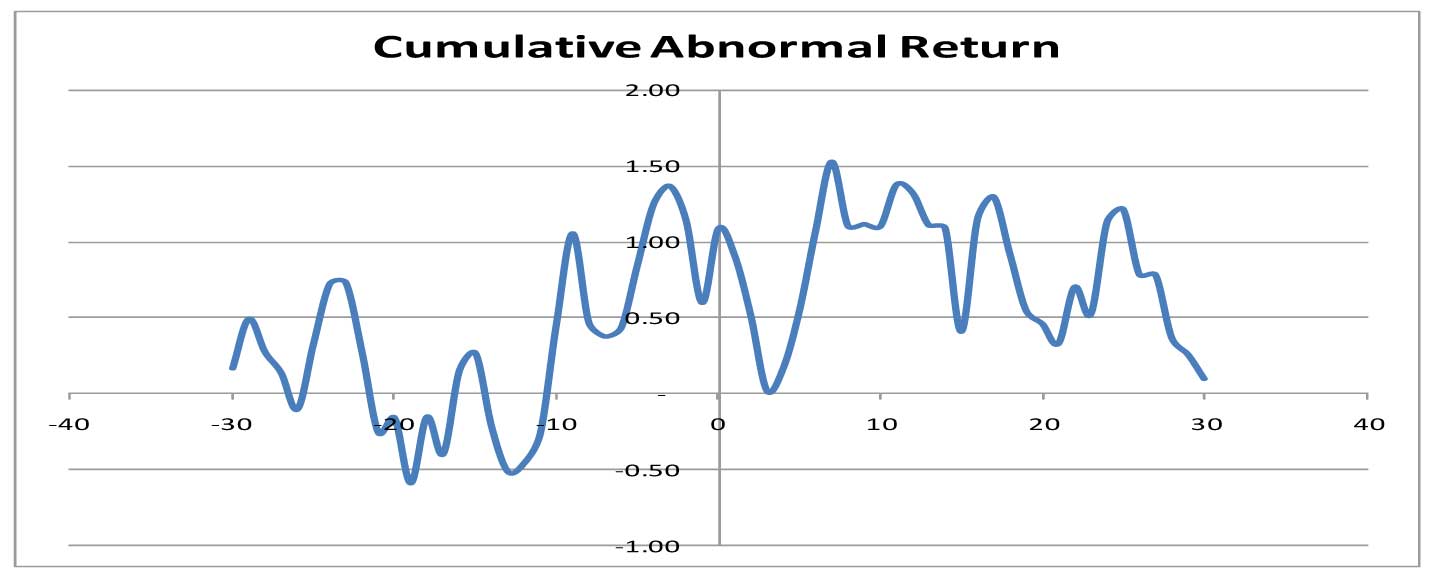
3.1.6 Test of strong form of efficiency of stock market
- Study conducted on the movement of share price of 30 selected firms around day 0 and Cumulative Abnormal Return (CAR) calculated and plotted. The graph fail to generate a pattern which can show that the Indian capital market satisfy strong form of efficiency.
4: Conclusions
- The basic constituents of the price-earnings ratio (growth of earnings, variability of earnings and dividend payout) failed to justify the Whitbeck Kisor model in the Indian context during the time frame 1996-2015.
- The testing of Capital Asset Pricing Model (CAPM) also reveals poor relationship between systematic risk and return of the stock market during the same time frame except for the years 2002, 2003 and 2006, 2007, a four years period among 20 years of study.
- The customized valuation model also failed to generate an acceptable relationship between price-earnings ratio and other variables since the overall r-square value is very low.
- This research argues that the reason behind this result is the inefficiency of the Indian stock market. All the three forms (weak, semi-strong and strong) were tested and the result was not encouraging. After the liberalization, and implementation of several policies by the Government of India, Indian stock market prominently showed the signs of inefficiencies. Hence this research raised the question that whether the valuation models do work in an inefficient market? If so, the definition of efficiency should consider not only the ‘informational efficiency’ but also the ‘market rationality’ and should not consider the two areas as independent and mutually exclusive. The stock market is said to be efficient if not only the information is quickly incorporated in to the price to restrict all the people (insiders and outsiders) to gain extra return but also should consider whether the price is reflected correctly or not. Hence ‘efficiency’ of stock market should consider not only the speed but also the information whether it is correctly reflected in the price of the stock.
References :
- Ansari, V. A. (2000). "Capital Asset Pricing Model: Should we stop using it?",Vikalpa, Vol.25, No.1, , pp. 55-64.
- Banz, R (1981). "The Relation between Return and Market Value of Common Stocks," Journal of Financial Economics, Vol 9, pp 3-18.
- Barua, S. K. (1981). The Short-Run Price Behavior of Securities: Some Evidence on Efficiency of Indian Capital Market, Vikalpa, April, Vol.6, No.2, pp.93-100.
- Barua, S. K. and Ralghunathan, V. (1987). Inefficiency and Speculation in the Indian Capital Market, Vikalpa, July-September, Vol.12, No.2, pp.53-58.
- Barua. S. K. and Raghunathan, V. (1990). Soaring Stock Prices: Defying Fundamentals. Economic and Political Weekly, November17, Vol.25, No.46: pp.2559-61.
- Basu, S. (1977). “Invest performance of common stocks in relation to their price-earnings ratios” The Journal of Finance, Vol.XXXII. No.3-June, pp 663-682.
- Bing, R. (1971). “Survey of Practitioners’ Stock Evaluation methods”, Financial Analysts Journal, 27, No 3, pp 55-69.
- Bower, R and Bower, D. (1969). “Risk and Valuation of common stock” Journal of Political Economy, 77, No 3, pp.349-362.
- Fama, E. (1970). “Efficient Capital Markets: A review of Theory and Empirical Work” Journal of Finance, XXV, No.2, pp.383-417.
- Fama, E., Fisher, L., Jensen, M. and Roll, R. (1969) “The Adjustment of Stock Prices to new Information” International Economic Review, 10, No.1, pp.1-21.
- Firth, M. (1975). "The Information Content of Large Investment Holdings," Journal of Finance, XXX, No 5, pp. 1265-1281.
- Good, W. (1972). “Valuation of Quality-Growth Stocks”, Financial Analysts Journal, 28, No 4, pp, 47-59.
- Graham, B., Dodd, D., and Cottle, S. (1962). Security Analysis Principles and
- Gupta, O. P. and Sehgal, S. (1993). "An Empirical Testing of Capital Asset Pricing Model in India," Finance India, Vol 7, No 4, December, pp 863-874.
- Jaffe, J. (1974). "Special Information and Insider Trading," Journal of Business, 47, No.3, pp.410-428.
- Maheshwari, G. E. and Vanjara, K. R. (1989). Risk Return Relationship: A Study of Selected Equity Shares, in Stock Market Efficiency and the Price Behaviour (the Indian Experience), Edited by O.P Gupta, First Eddition, Anmol Publication, New Delhi, pp. 335-52.
- Roll, R. and Ross, S.A. (1994). “On the Cross-Sectional Relation between Expected Returns and Betas", Journal of Finance, Vol.49, Issue 1, pp 101-121.
- Sharpe, W. F. (1964). Capital Asset Prices: A Theory of Market Equilibrium under Conditions of Risk. Journal of Finance, 425-442.
- Shiller, R. J. (1984). "Theories of Aggregate Stock Price Movements," The Journal of Portfolio Management, pp. 28-37.
- Srinivasan, N. P and Narasimhan, M. S. (1988). Testing Stock Market Efficiency Using Risk-Return Parity Rule, Vikalpa, April-June, Vol.13, No.2, pp. 61-66.
- Whitbeck,V. and Kisor, M. (1963) ‘A new tool in investment Decision Making’, Financial Analysts Journal, pp. 55-62.
- Yalwar, Y. B. (1988). "Bombay Stock Exchange: Rates of Return and Efficiency," Indian Economic Journal, Vol 35, No 4, April-June, pp 68-121.